| We (us here on twinturbo.net) have seemingly come a few steps ahead in general knowledge related to dyno numbers, how one can make really good numbers, what kind of power curves are desirable, etc etc.. I've definately learned a good bit from a number of knowledgable members with the questions they have posted and statements made so please dont feel like I'm just off on a 'better than thou' stint. I know enough to know that I dont know all there is to know - we'll leave it at that.. ;-) One of the things that has been in mind has to do with the difference between producing peak numbers vs. tuning for best overall performance. They both actually serve two different purposes. While knowing that a tune which produces the best results in a real-world scenario such as drag racing, auto-x racing or any other sort of driving activity will likely not be the same as the tune that produced the best peak numbers, the peak number run gives insight into other important information. There is an enormous number of considerations and options to take when building your powerplant and typically those would cater to a particular goal one sets in mind. One's budget usually is the biggest constraint to what those options will be in the end else we would all have 7 Z's which are setup for peak performance in the particular class of driving you choose for that day of the week. :) However, even with a limitless budget it must still be determined what exact components are required to produce the desired results. This is where empirical testing comes into play. Dyno testing gives a dizzying array of information about a particular setup. Spoolup characteristics, torque and power curves, boost pressures, A/F ratios, EGT's; these only scratch the surface of the information one can gather. One of the biggest sources of data is the ECU parameters within the fuel maps, timing maps, and a few other various points of data such as VTC release RPM, MAS voltage, and TP values are of the most important. This information provides volumes of information about how you are getting the plots that the dynojet machine spits out. While tuning a vehicle, there's a lot more to it than just turning up the boost and making a run. There are usually several preliminary pulls made at low boost to begin building the fuel map. Once the fuel delivery has been optimized, then boost and timing start going up steps at a time until eventually you produce the best numbers possible from that setup without detonation. Once you have reached the upper boundary of fuel/timing/boost, you now have determined not only what the maximum power output the setup can produce, but you also have determined what values (fuel and timing) were required to produce those numbers and how to 'pad' them to ensure the car will be able to make 50-150MPH WOT pulls when desired without grenading to pieces. In the end, a dyno session is far more than just shooting for peak numbers - each pull is unique and from the points of information listed you can make good determinations of the capabilities of that particular setup. Going into elaborate details about parameters in the timing maps, fuel maps, EGTs, etc etc etc become far more than the scope of a writeup and begin approaching doctoral thesis material. =) The twinturbo.net posts about dyno days always draw people because readers know that the information contained within gives insight to the hardware configuration used. Being able to show what the absolute most amount of power achievable by a given setup does not give enormous insight into what it may produce down the 1320', but it does give volumes of information for comparisons to other setups that are tested on the same machine. As an example: This is Todd Reeve's non-turbo engine with stock twinturbos and associated hardware installed.
 Marco's Stage III TT
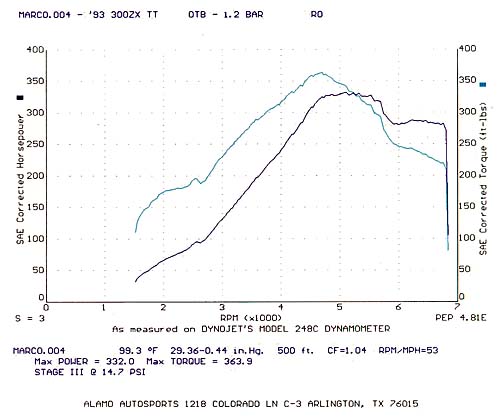 From these two dynocharts, an good bit of information can be realized. These two dynocharts were produced at similar boost pressures but the way they make power differs tremendously. You can see that Todd's turbo'd NA continued to make more and more horsepower as RPMs increased whereas the stage3TT's fell off. This is as a result of different compression ratios these engines have(8.5:1 vs. 10.5:1). Rememeber, these cars have the same cams and turbos. This is just one thing pointed out in a large number of other points that could be made from the data shown. Peak numbers of 322/308 vs. 332/363 is another relative point of data when comparing these results that gives good insight into the behavior of the components used. Keep in mind that this is only one chart per car as well; typical dyno sessions usually have 15+ different runs all with their own bit of insight to how the system behaves. This is the kind of information that can only be acquired by use of a dynomometer.

[ ashleypowers.com ]
[ agpowers@bellsouth.net ] [ Zemulator Information Sheet ] [ Z1 Motorsports Website ]
.JPG) Enthusiasts soon understand each other. --W. Irving.
Are you an enthusiast?
|


 A thought... or two... on dyno tuning and peak numbers... > -