| I don't think I totally understand your question, so I apologize in advance if I'm just rambling about crap you already know, but I figure this might be useful for others reading, too. The seemingly arbitrarily "high numbers" and "low numbers" are used to differentiate between open loop and closed loop. In the fuel map this is obvious, I'm not totally certain how this is used on the timing map (but I believe it has to do with input from the knock sensor). For example, take a look at this view of the fuel map. 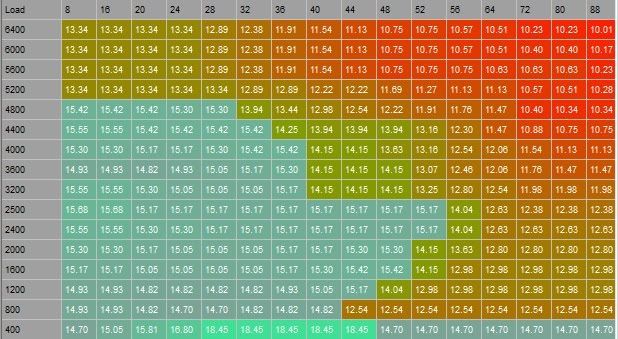
All of the teal-highlighted cells are cells which are accessed in closed loop (O2 sensor feedback as you know). Everything else is open-loop and ignores the O2 sensors.
These are target air-fuel ratios filtered to make sense to us. But if we look at the raw values, the map looks a bit different, this is what I believe you were referring to (though using a timing map in your example; the fuel map view makes a bit more sense to me since I'm unclear on the closed/open loop distinction in timing maps).
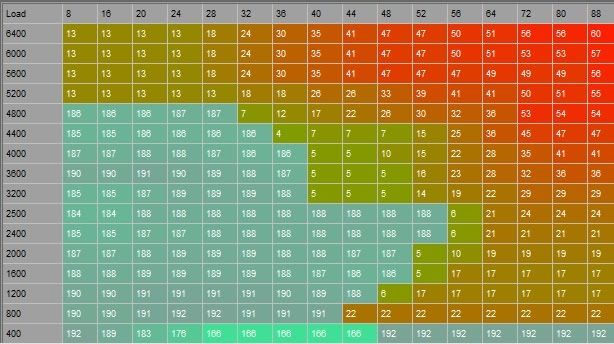
You can see the closed-loop cells are all over 128. This is how the ECU recognizes the distinction between cells used for closed loop or open loop.
When a cell over 128, the ECU knows to use it for closed loop. The target AFR for that cell can then be calculated with this formula:
AFR = 1881.6/(cell value - 64)
So, the 400rpm x 8tp cell, which has a raw value of 192, would have a target AFR of 14.7:1 (convenient, right?), and the ECU will listen to O2 feedback to achieve that target AFR. Cells which have a value below 128 are calculated with this formula:
AFR = 1881.6/(cell value + 128)
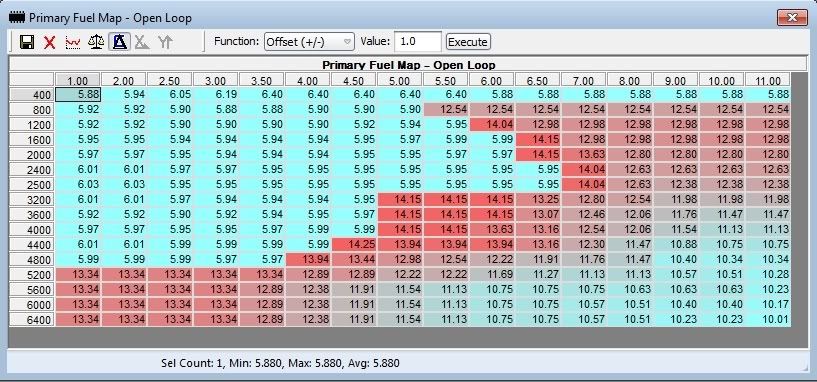
So, for example, if we look at 4400rpm x 44tp, the value is 7. The ECU uses this formula because it's value is below 128, and the result is a target AFR of ~13.94:1. This is further illustrated by looking at the fuel maps in TunerPro. Since TunerPro can only use one algorithm to filter the values on a map at a time, it can't display open and closed loop values on one map and have them all make sense. So the TunerPro definitions for the Z32 have a display for the fuel map in Closed Loop and in Open Loop.
Here's the Open Loop display. You can see the cells in blue don't make any sense, because they're all over 128 and the algorithm to display target AFRs for open loop doesn't work with the closed loop cells.
 When we look at the map with the Closed Loop view, the reverse is true.
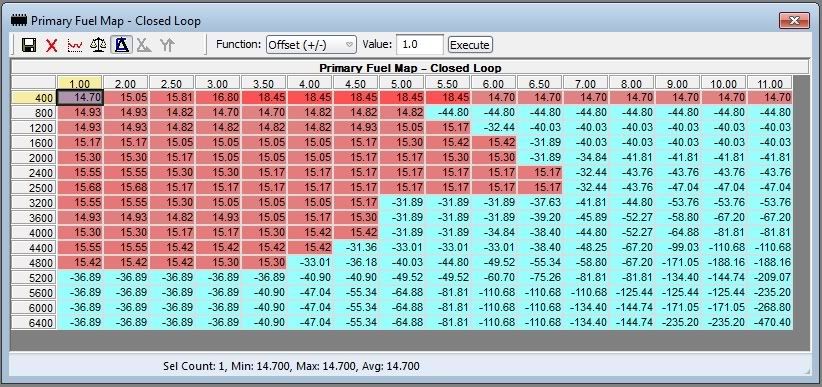
Now the cells over 128 are calculated correctly and make sense, but the rest don't. Both of these views are showing the same map, they're just plugging the information through different formulas to filter them. It's kind of obnoxious because you can't view the map with one display, but it works. So, when you see tuners change the values above/below this 128 threshold, it's simply the way to change the cell between being an open loop or closed loop cell. The difference in high numbers (above 128) and low (below 128) is just there, as far as I know, so the ECU knows which cells get O2 sensor feedback and which don't.
 |


